
Measuring Population Change
Unravelling the dynamics of population change

Measuring Population Change
Geographers measure population change by looking at how many people are born, how many die, and how many move in or out of a place. In other words, population change is driven by three main components: fertility, mortality and migration.
Key components
Fertility – the frequency of childbearing in a population (births).
Mortality – the frequency of deaths in a population.
Migration – the movement of people into (immigration) and out of (emigration) an area.
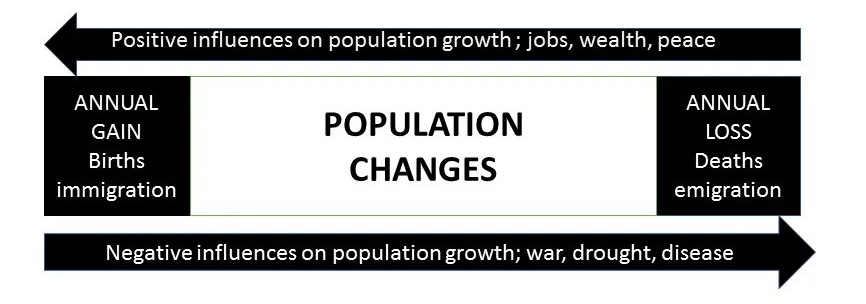
Total population change over a period can be summarised as:
Population change=Births−Deaths+Net migration
Net migration is calculated by subtracting emigration from immigration. The difference between births and deaths is called natural increase (or natural decrease if deaths exceed births).
Births and Fertility
Crude Birth Rate (CBR)
The crude birth rate is the number of live births per 1,000 people in a year, usually based on a mid‑year population. It is easy to calculate and useful for a quick comparison, but it has two major limitations:
It does not account for age structure – countries with a large proportion of young adults will tend to have more births even if individual women have relatively few children.
It cannot show differences in fertility between specific age groups of women.
Total Fertility Rate (TFR)
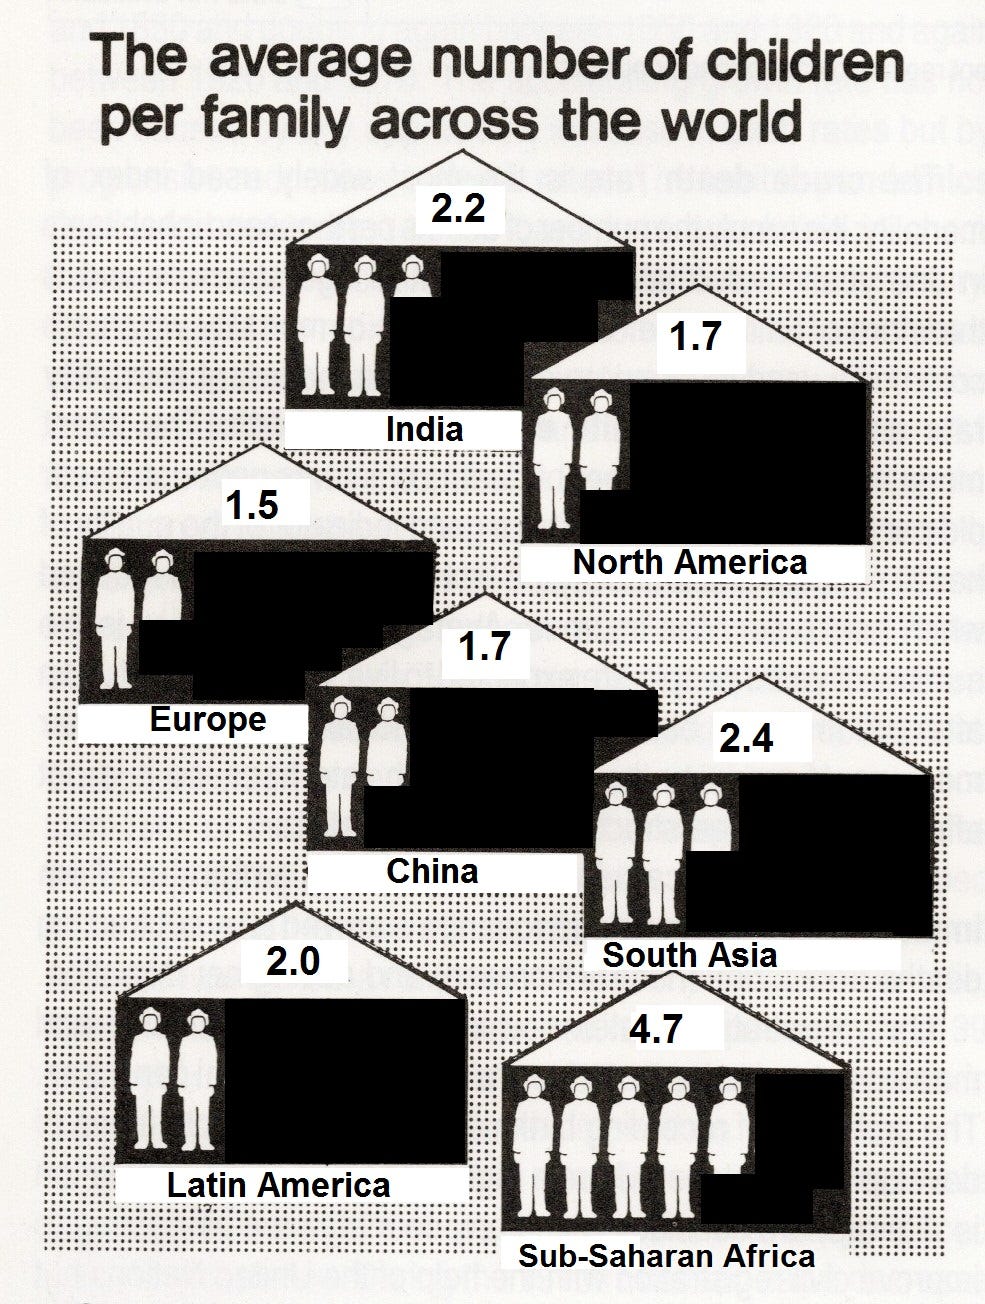
To overcome this, geographers use the total fertility rate (TFR) – the average number of children a woman is expected to have over her lifetime if current age‑specific fertility rates remain constant. Globally, TFR has fallen from more than 5 children per woman in the 1960s to around 2.4–2.5 in 2020, with further declines expected this century.
In 2020, TFRs ranged from very high values (around 6.9 in Niger) to extremely low values (close to 1.0 in places such as Puerto Rico), illustrating strong regional contrasts in fertility behaviour. In many African countries, TFR is currently above 5 but is projected to fall to around replacement level (a little over 2) by 2100, as Africa’s share of the world population rises.
Deaths and Mortality
Crude Death Rate (CDR)
The crude death rate is the number of deaths per 1,000 inhabitants in a year. Like CBR, it is affected by age structure and is therefore limited for comparing countries; a country with many elderly people may have a high death rate even if health care is very good.
Infant Mortality Rate (IMR)
The infant mortality rate is the number of deaths of infants under one year of age per 1,000 live births. It is a sensitive indicator of:
The quality and accessibility of maternal and child health care.
Nutrition, sanitation and wider living conditions.
IMR is usually one of the first mortality indicators to improve when health systems and public health measures are strengthened.
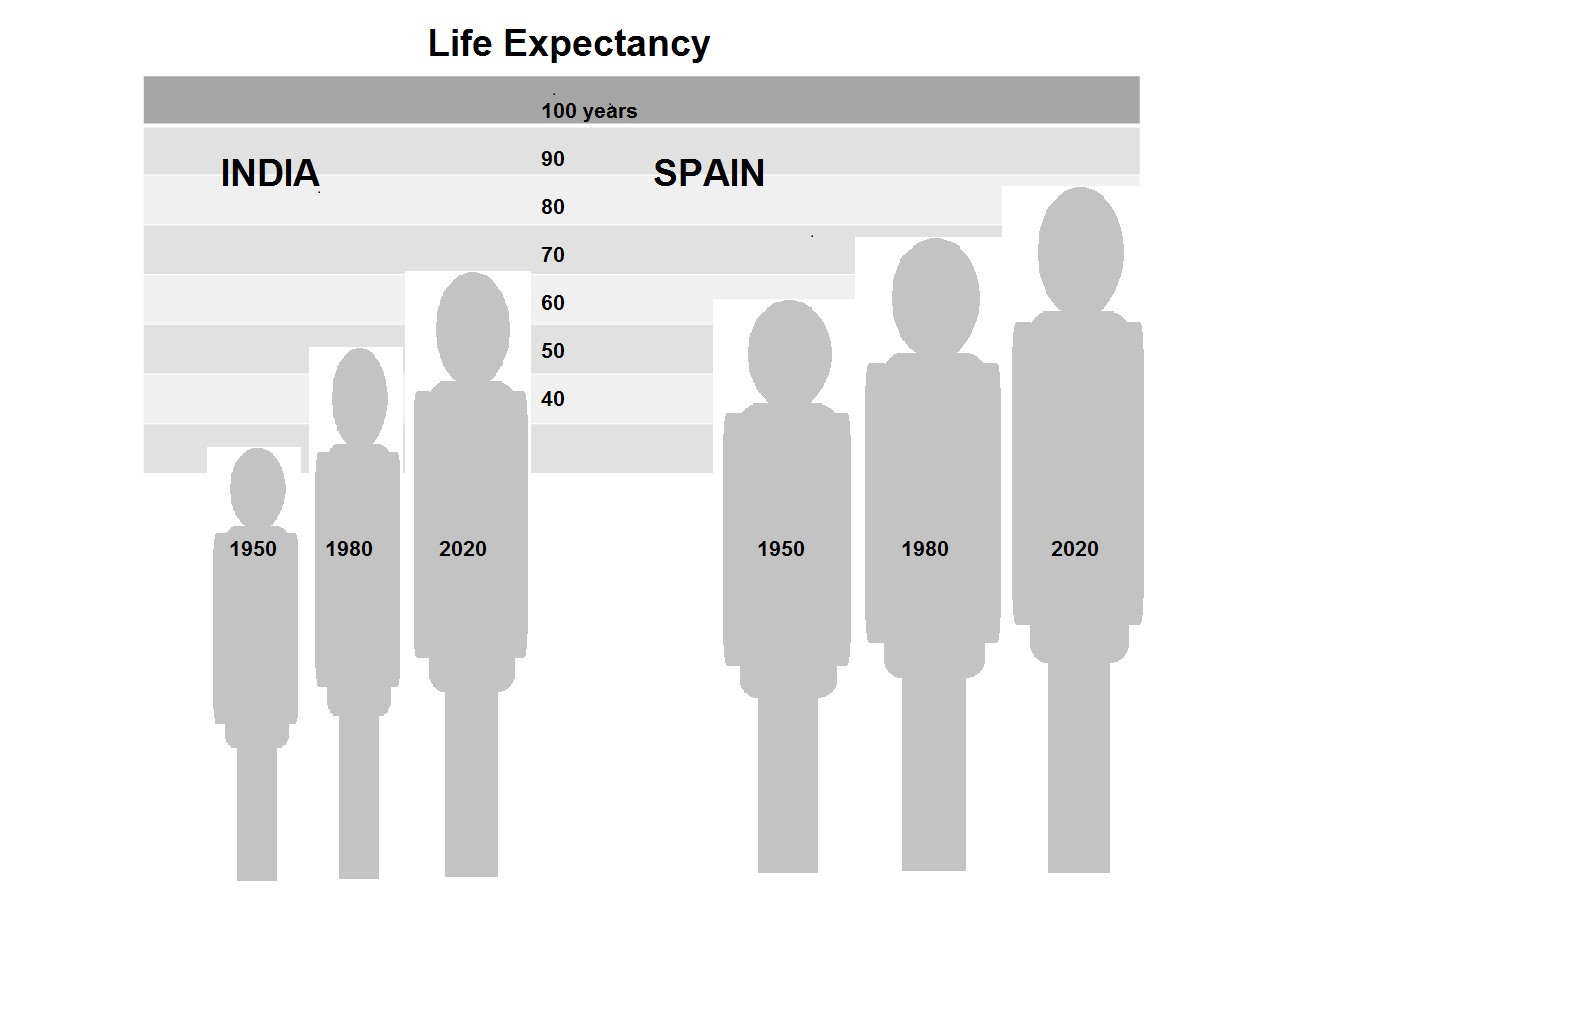
Life Expectancy
Life expectancy at birth is the average number of years a newborn is expected to live if current mortality patterns continue. Globally, life expectancy has risen from around 30 years in 1900 to more than 70 years in recent years, with substantial regional variation. For example, many high‑income countries exceed 80 years, whereas life expectancy in the least developed countries of sub‑Saharan Africa remains significantly lower.
Life expectancy is considered a better overall measure of mortality than crude death rate because it is less affected by age structure and summarises survival chances across all age groups.
Migration and Total Population Change
Migration can significantly alter population size and structure, especially at national or regional scales. A country with low natural increase can still grow in population if it experiences high net immigration, and vice versa. In demographic analysis, total population change is therefore a combination of natural change and migration.
Measuring Population: Data and Reliability
Population measures depend on accurate data. Two key sources are:
Civil registration systems – continuous recording of births, deaths and marriages.
Censuses and sample surveys – periodic, often every 5 or 10 years, counting and profiling the population.
In many least developed countries, civil registration systems are incomplete due to issues such as remoteness, limited infrastructure and low literacy levels, making vital events harder to record accurately. The United Nations often uses model life tables, sample surveys, and trends from neighbouring countries with similar socio‑economic profiles to estimate population indicators where reliable national data are lacking.

Patterns of Fertility and Mortality
Global fertility patterns
The global TFR in 2020 was just under 2.5 children per woman, about half the level of 50 years earlier.
High fertility (TFR > 4–5) remains concentrated mainly in parts of West and Central Africa and some areas of the Middle East.
Very low fertility (TFR < 1.5) occurs in a growing number of high‑income and upper-middle-income countries, especially in East Asia and Europe.
Crude birth rates above 40 per thousand are now largely confined to a few African countries, whereas many European and East Asian countries have crude birth rates below 13 per thousand. These differences are closely linked to levels of development, women’s education, access to contraception, and cultural norms about family size.
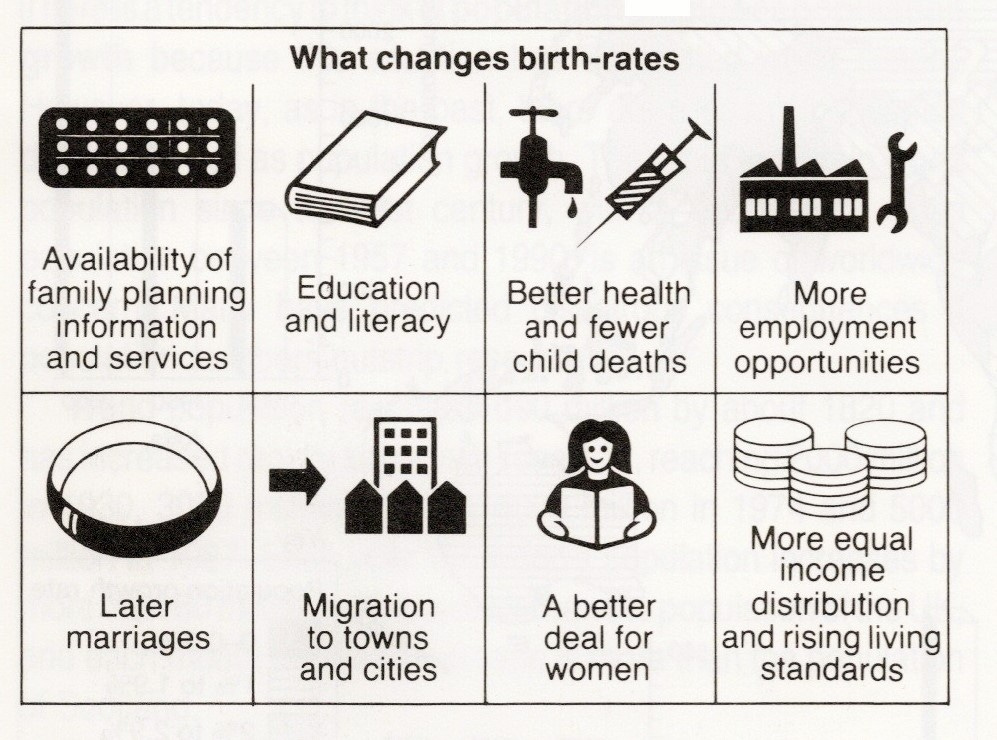
Drivers of fertility decline
A wide range of social and economic factors have contributed to falling fertility:
Empowerment and education of women, leading to later marriage and childbearing.
Increased use and availability of contraception and family planning services.
Rising costs of raising children (education, housing) and reduced economic value of child labour.
Urbanisation, changing social norms, and aspirations for higher living standards.
Many countries have implemented national family planning programmes to accelerate fertility decline, with notable success in places such as Thailand, South Korea, Iran and others.
Mortality and life expectancy
Mortality has generally become more stable and predictable than fertility, with death rates falling markedly over the past century due to:
Advances in medical care and pharmaceuticals.
Public health interventions (vaccination, clean water, and sanitation).
Improved nutrition and living conditions.
Global life expectancy increased from around 46 years in 1950 to over 70 years by 2020, but regional gaps remain substantial, with some African countries still experiencing much lower life expectancy than Europe or Japan.
As world variations in death rates narrow, fertility has become the main determinant of long‑term population growth.
Exam Style Questions
Definitions (4 marks each)
Define crude birth rate and explain one limitation of using it to compare different countries.
Define infant mortality rate and give one reason why it is a good indicator of health conditions.
Explain the difference between natural increase and net migration.
Data interpretation (6 marks)
If Country X with a crude birth rate of 40 per 1,000 and Country Y with a crude birth rate of 10 per 1,000, both have the same TFR of 2.1.
Describe the apparent contradiction (3 marks).
Explain how age structure could account for this pattern (3 marks).
A graph shows global life expectancy rising from 46 years in 1950 to about 72 years in 2020, while the global crude death rate falls from around 18 per 1,000 to under 8 per 1,000.
Describe the trends shown (4 marks).
Explain two reasons for the fall in crude death rate (2 marks).
Structured essay (10 marks each)
“Reliable measurement of fertility and mortality is essential for effective population policies.”
Discuss this statement with reference to both developed and developing countries.
Using examples, evaluate the view that declining fertility is more important than falling mortality in shaping future global population change.
Assess the strengths and weaknesses of using crude birth rate, crude death rate, infant mortality and life expectancy as indicators of development.
REFERENCES
Dorling, D. (2013) Population 10 Billion: The Coming Demographic Crisis and How to Survive It. Constable.
Weeks, J. (2015) Population: An Introduction to Concepts and Issues (12th ed.). Cengage Learning.
Livi‑Bacci, M. (2017) A Concise History of World Population (6th ed.). Wiley‑Blackwell.
Bailey, A. & Boyle, P. (2004) Population Geography: Problems, Concepts and Prospects. Springer.
UN and international reports
United Nations, Department of Economic and Social Affairs (UN DESA) (2022) World Population Prospects 2022: Summary of Results.
United Nations, UN DESA (2020) World Fertility and Family Planning 2020: Highlights.
UN DESA / IISD (2022) Population Data Critical for Sustainable Development (SDG‑linked policy brief).
UNFPA (various years) State of World Population (annual reports on fertility, mortality, reproductive health).
Key journal article
Vollset, S. E. et al. (2020) “Fertility, mortality, migration, and population scenarios for 195 countries and territories from 2017 to 2100.” The Lancet, 396(10258): 1285–1306.
Data‑rich online resources for students
Our World in Data – Fertility Rate, Mortality, Life Expectancy, and World Population Growth (excellent interactive charts, downloadable data).
World Bank Data – indicators such as crude birth rate, crude death rate, TFR, infant mortality, life expectancy, and net migration for all countries.
WHO – GHO Life Expectancy and Global Health Estimates (mortality and life expectancy tables).
Population and Migration Book
If you would like to support my resources scan the QR code below and Buy me a Coffee